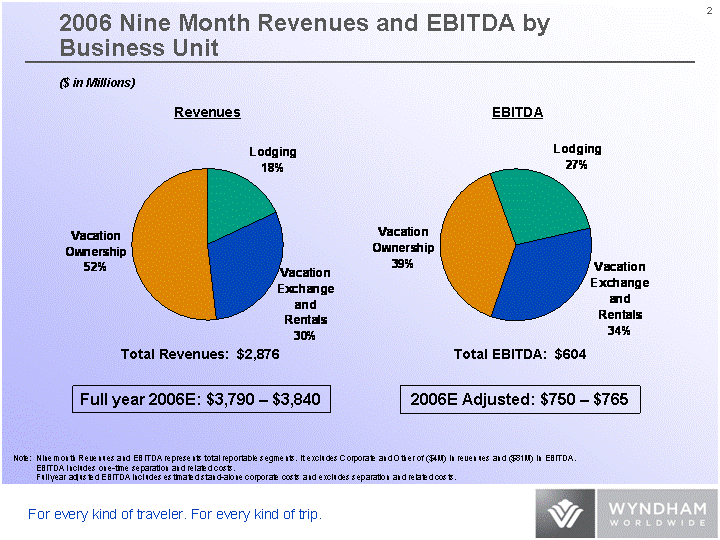

| 2006 Nine Month Revenues and EBITDA by Business Unit Lodging 0.27 0.27 Vacation Exchange and Rentals 0.34 0.34 Vacation Ownership 0.391 0.39 Lodging 0.18 Vacation Exchange and Rentals 0.3 Vacation Ownership 0.52 Revenues EBITDA Total Revenues: $2,876 Total EBITDA: $604 ($ in Millions) Note: Nine month Revenues and EBITDA represents total reportable segments. It excludes Corporate and Other of ($4M) in revenues and ($81M) in EBITDA. EBITDA includes one-time separation and related costs. Full year adjusted EBITDA includes estimated stand-alone corporate costs and excludes separation and related costs. Full year 2006E: $3,790 - $3,840 2006E Adjusted: $750 - $765 2 |

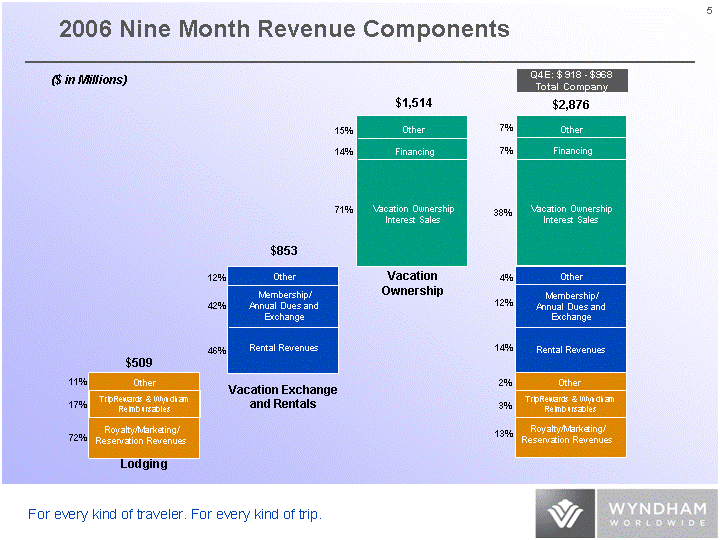
| 2006 Nine Month Revenue Components ($ in Millions) Lodging $509 Vacation Exchange and Rentals $853 Vacation Ownership Other Financing Vacation Ownership Interest Sales $1,514 Membership/ Transaction Revenue Other Financing Vacation Ownership Interest Sales $2,876 Other Membership/ Annual Dues and Exchange Rental Revenues Membership/ Transaction Revenue Other Rental Revenues Membership/ Annual Dues and Exchange 42% 12% 46% 15% 14% 71% 7% 7% 38% 4% 12% 14% Q4E: $ 918 - $968 Total Company Royalty/Marketing/ Reservation Revenues TripRewards & Wyndham Reimbursables Other 11% 17% 72% 2% 3% 13% Royalty/Marketing/ Reservation Revenues TripRewards & Wyndham Reimbursables Other 5 |

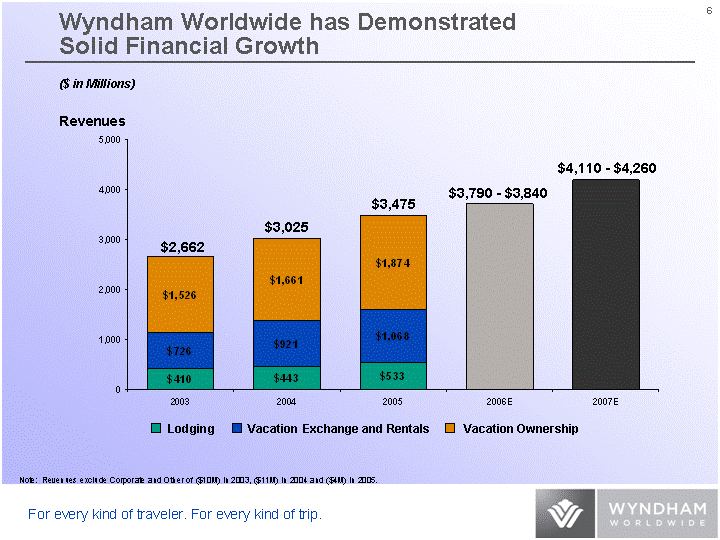
| Lodging RCI WVO 1998 1999 2000 485 485 2001 634 0 463 2003 410 726 1526 2004 443 921 1661 2005 533 1068 1874 2006E 3720 2007E 4190 Wyndham Worldwide has Demonstrated Solid Financial Growth Revenues $2,662 $3,025 $3,475 ($ in Millions) $3,790 - $3,840 $4,110 - $4,260 Note: Revenues exclude Corporate and Other of ($10M) in 2003, ($11M) in 2004 and ($4M) in 2005. Lodging Vacation Exchange and Rentals Vacation Ownership 6 |

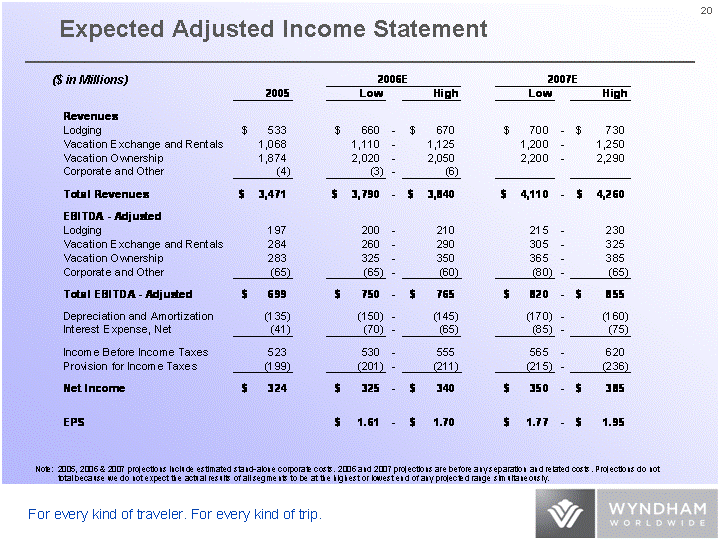
| Expected Adjusted Income Statement Note: 2005, 2006 & 2007 projections include estimated stand-alone corporate costs. 2006 and 2007 projections are before any separation and related costs. Projections do not total because we do not expect the actual results of all segments to be at the highest or lowest end of any projected range simultaneously. ($ in Millions) 20 |