

| Forward Looking Statements These presentations contain forward-looking statements within the meaning of federal securities laws. These forward-looking statements generally can be identified by phrases such as Wyndham Worldwide or its management "believes," "expects," "anticipates," "foresees," "forecasts," "estimates" or other similar words or phrases. Similarly, statements that describe our business strategy, outlook, objectives, plans, intentions or goals also are forward-looking statements. Forward-looking statements are not guarantees of future performance and involve risks and uncertainties and other factors that may cause actual results to differ materially from those anticipated at the time the forward-looking statements are made. Future results, performance and achievements may be affected by general economic conditions, the impact of war and terrorist activity, business and financing conditions, foreign exchange fluctuations, cyclicality and operating risks associated with the hospitality industry including the hotel, vacation exchange and vacation ownership businesses, competition, governmental and regulatory actions (including the impact of changes in U.S. and foreign tax laws and their interpretation) and other circumstances and uncertainties. These risks and uncertainties are presented in detail in our filings with the Securities and Exchange Commission. Although we believe the expectations reflected in such forward- looking statements are based upon reasonable assumptions, we can give no assurance that our expectations will be attained or that results will not materially differ. We undertake no obligation to publicly update or revise any forward-looking statement, whether as a result of new information, future events or otherwise. |

| Wyndham Worldwide Corporation Stephen P. Holmes Chairman & CEO |
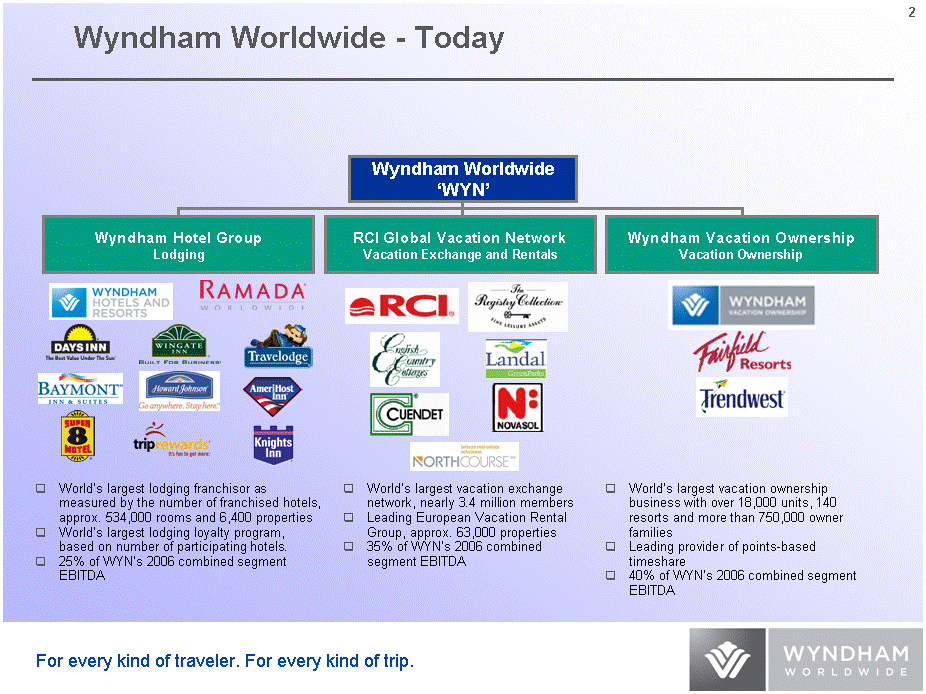
| Wyndham Worldwide - Today Wyndham Worldwide 'WYN' Wyndham Hotel Group Lodging RCI Global Vacation Network Vacation Exchange and Rental Wyndham Vacation Ownership Vacation Ownership World's largest lodging franchisor as measured by the number of franchised hotels, approx. 534,000 rooms and 6,400 properties World's largest lodging loyalty program, based on number of participating hotels. 25% of WYN's 2006 combined segment EBITDA World's largest vacation ownership business with over 18,000 units, 140 resorts and more than 750,000 owner families Leading provider of points-based timeshare 40% of WYN's 2006 combined segment EBITDA World's largest vacation exchange network, nearly 3.4 million members Leading European Vacation Rental Group, approx. 63,000 properties 35% of WYN's 2006 combined segment EBITDA Wyndham Worldwide 'WYN' Wyndham Hotel Group Lodging RCI Global Vacation Network Vacation Exchange and Rentals Wyndham Vacation Ownership Vacation Ownership |

| Wyndham Worldwide - History, Strategy for Growth 1990 1995 2000 2005 Demographics and Travel Trends Baby Boomers Leisure Travel International Generation X Emerging Markets Family Travel |
| Wyndham Worldwide - Future, Strategy for Growth Hospitality powerhouse with well-recognized brands, quality service and a diverse range of properties. Growth Factors Baby Boomers Generation X Family and Leisure travel trends International customers and markets |
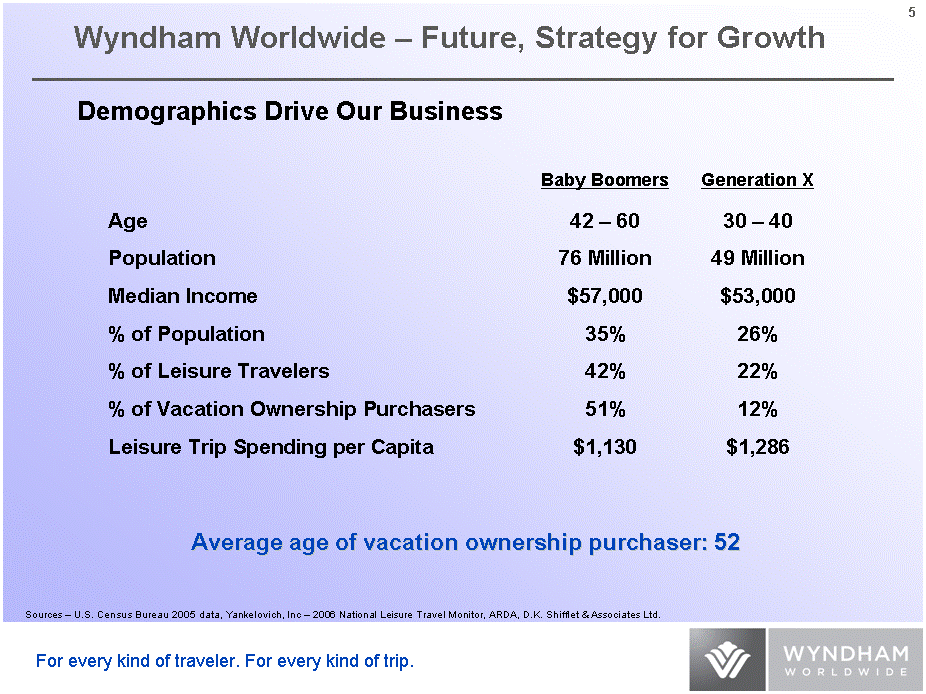
| Wyndham Worldwide - Future, Strategy for Growth Demographics Drive Our Business Sources - U.S. Census Bureau 2005 data, Yankelovich, Inc - 2006 National Leisure Travel Monitor, ARDA, D.K. Shifflet & Associates Ltd. Average age of vacation ownership purchaser: 52 Baby Boomers Generation X Age 42 - 60 30 - 40 Population 76 Million 49 Million Median Income $57,000 $53,000 % of Population 35% 26% % of Leisure Travelers 42% 22% % of Vacation Ownership Purchasers 51% 12% Leisure Trip Spending per Capita $1,130 $1,286 |
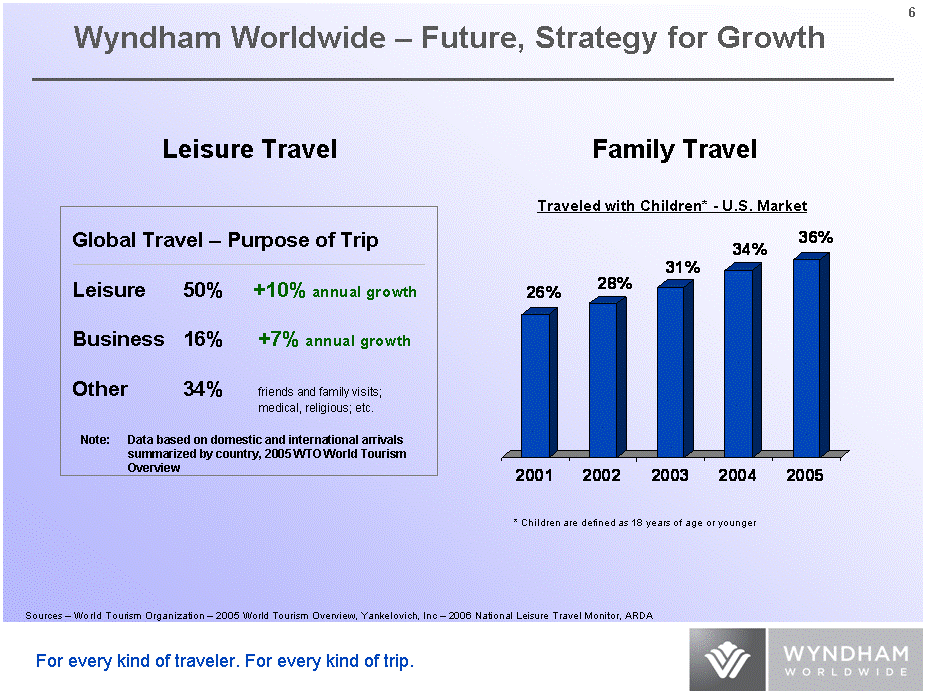
| Wyndham Worldwide - Future, Strategy for Growth Leisure Travel Sources - World Tourism Organization - 2005 World Tourism Overview, Yankelovich, Inc - 2006 National Leisure Travel Monitor, ARDA Global Travel - Purpose of Trip Leisure 50% +10% annual growth Business 16% +7% annual growth Other 34% friends and family visits; medical, religious; etc. Note: Data based on domestic and international arrivals summarized by country, 2005 WTO World Tourism Overview Family Travel 2001 2002 2003 2004 2005 0.26 0.28 0.31 0.34 0.36 Traveled with Children* - U.S. Market * Children are defined as 18 years of age or younger |
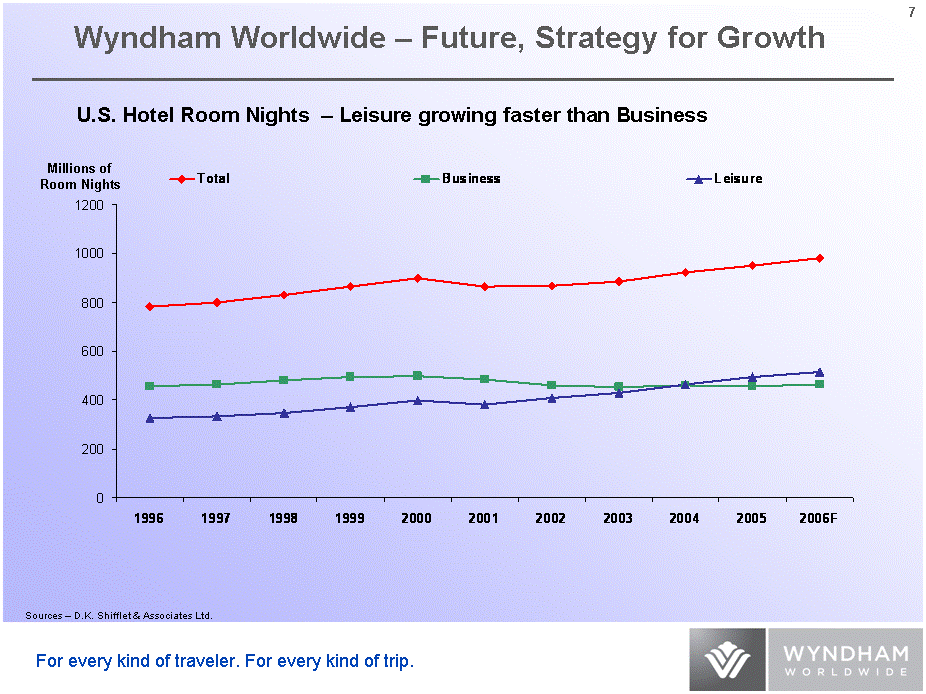
| Wyndham Worldwide - Future, Strategy for Growth 1996 1997 1998 1999 2000 2001 2002 2003 2004 2005 2006F Total 781 798 828 864 897 865 869 884 923 950 979 Business 455 464 480 493 498 484 461 454 461 456 464 Leisure 326 333 348 372 399 381 408 430 462 493 515 U.S. Hotel Room Nights - Leisure growing faster than Business Millions of Room Nights Sources - D.K. Shifflet & Associates Ltd. |
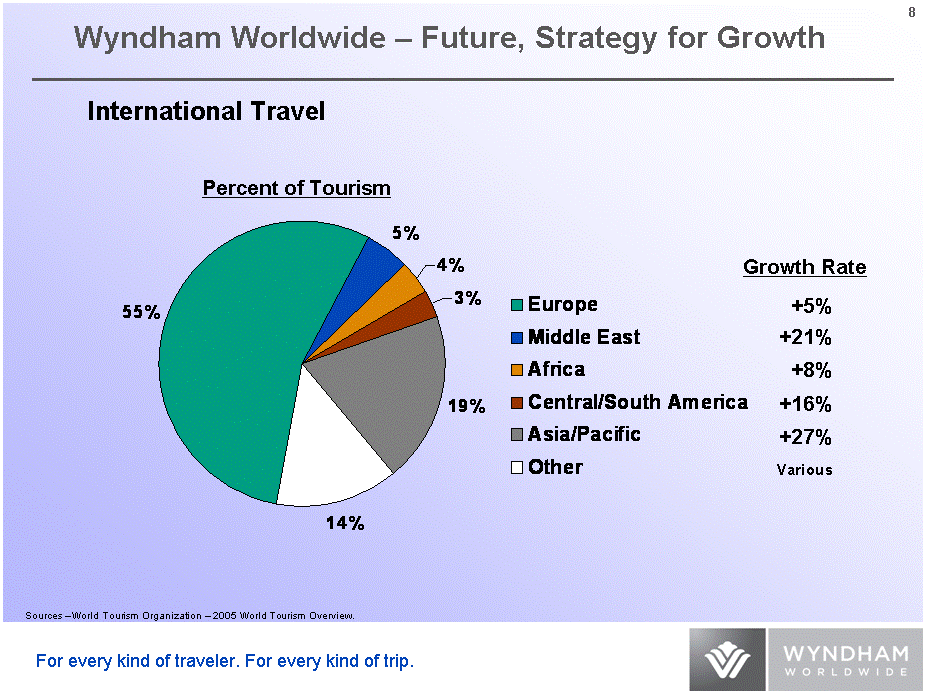
| Wyndham Worldwide - Future, Strategy for Growth Sources -World Tourism Organization - 2005 World Tourism Overview. International Travel Europe Middle East Africa Central/South America Asia/Pacific Other East 0.55 0.05 0.04 0.03 0.19 0.14 West North Percent of Tourism Growth Rate +5% +21% +8% +16% +27% Various |
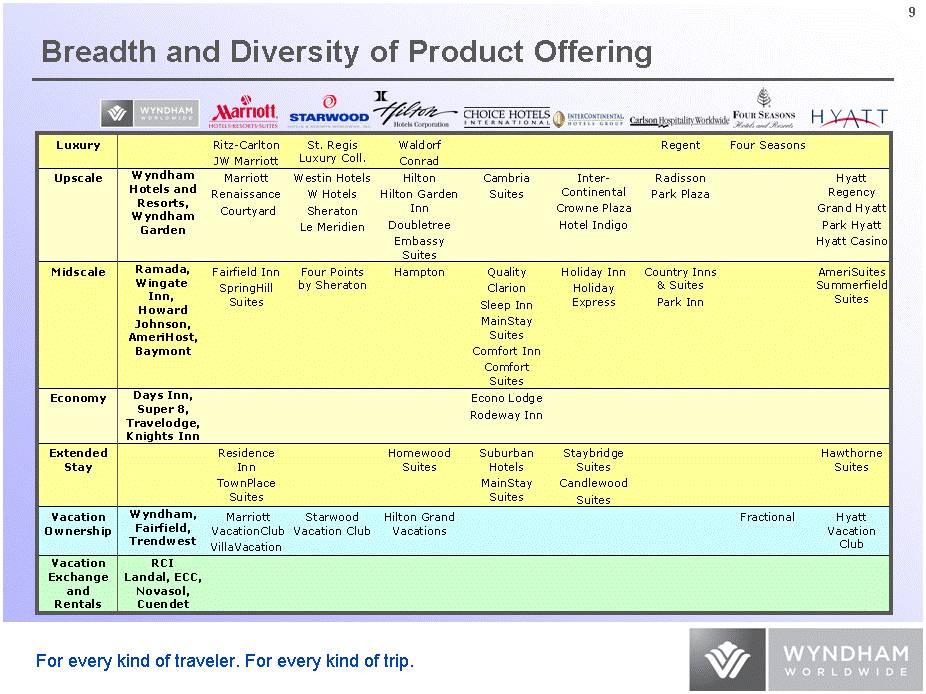
| Breadth and Diversity of Product Offering |
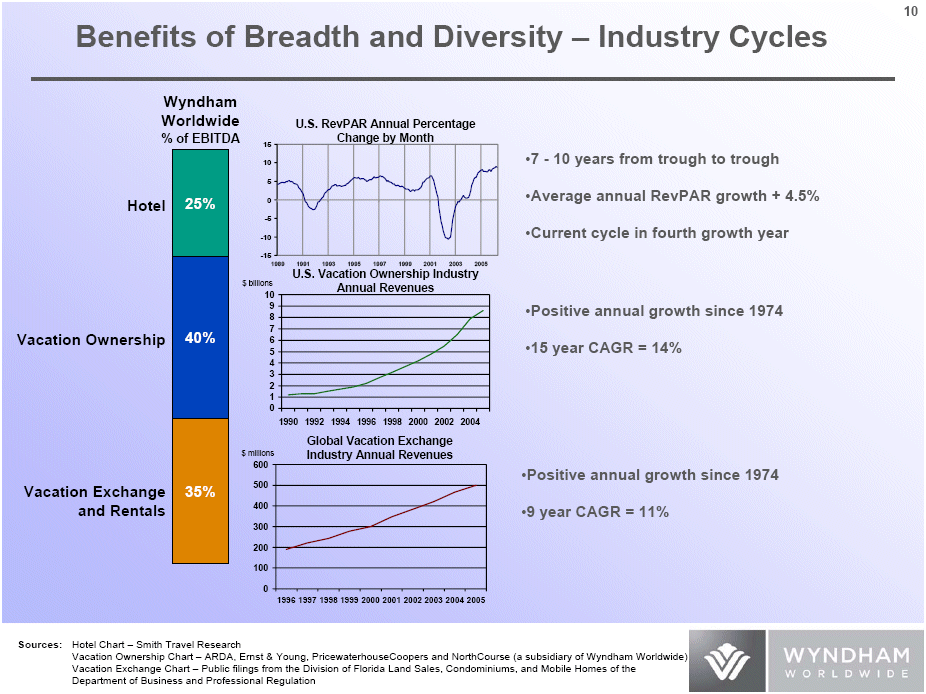
| Benefits of Breadth and Diversity - Industry Cycles 25% 40% 35% Hotel Vacation Ownership Vacation Exchange and Rentals Wyndham Worldwide % of EBITDA RevPAR % Chg 1989 4.1 4.3 4.5 4.6 4.7 4.7 4.6 4.6 5 4.9 5.1 5.2 4.9 5 4.9 4.5 4.4 4.3 4.2 4 3.2 3 2.5 2.1 1991 1.6 0.6 -0.5 -0.7 -1.2 -1.8 -2 -2.3 -2.4 -2.6 -2.6 -2.5 -2.1 -1.4 -0.6 -0.5 -0.2 0.2 0.6 0.8 1.6 1.9 2.2 2.5 1993 2.8 2.8 3.2 3.6 3.8 3.9 4.1 4.1 3.7 3.8 3.9 3.8 3.6 3.7 3.8 3.9 3.9 4.3 4.4 4.6 5 5.2 5.5 5.7 1995 6 6 5.9 5.8 6.1 5.8 5.6 5.7 5.7 5.7 5.5 5.3 5 5.1 5.3 5.5 5.4 5.6 5.9 6.2 5.9 6 6.1 6.1 1997 6.4 6.5 6.2 U.S. RevPAR Annual Percentage Change by Month 7 - 10 years from trough to trough Average annual RevPAR growth + 4.5% Current cycle in fourth growth year 1990 1.2 1991 1.3 1992 1.3 1993 1.5 1994 1.7 1995 1.9 1996 2.2 1997 2.7 1998 3.2 1999 3.7 2000 4.2 2001 4.8 2002 5.5 2003 6.5 2004 7.9 2005 8.6 U.S. Vacation Ownership Industry Annual Revenues Positive annual growth since 1974 15 year CAGR = 14% $ billions 1996 1997 1998 1999 2000 2001 2002 2003 2004 2005 191 222 244 278 300 347 384 421 467 500 Global Vacation Exchange Industry Annual Revenues Positive annual growth since 1974 9 year CAGR = 11% $ millions Hotel Chart - Smith Travel Research Vacation Ownership Chart - ARDA, Ernst & Young, PricewaterhouseCoopers and NorthCourse (a subsidiary of Wyndham Worldwide) Vacation Exchange Chart - Public filings from the Division of Florida Land Sales, Condominiums, and Mobile Homes of the Department of Business and Professional Regulation Sources: |
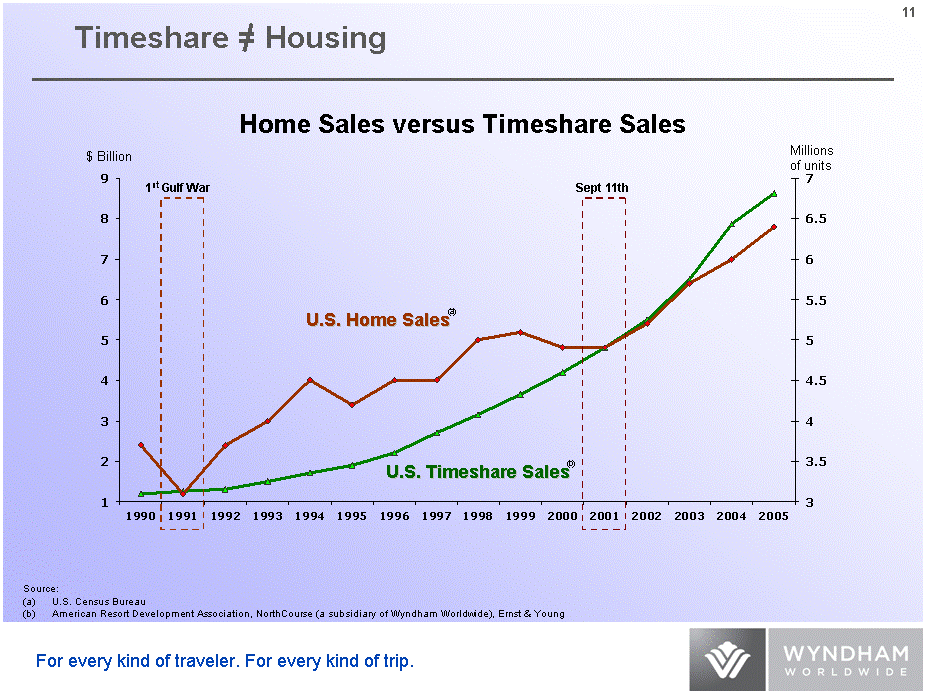
| New Housing Starts U.S. Timeshare Sales 1990 3.7 1.2 1991 3.1 1.25 1992 3.7 1.3 1993 4 1.5 1994 4.5 1.7 1995 4.2 1.9 1996 4.5 2.2 1997 4.5 2.7 1998 5 3.15 1999 5.1 3.65 2000 4.9 4.2 2001 4.9 4.8 2002 5.2 5.5 2003 5.7 6.48 2004 6 7.87 2005 6.4 8.61 (a) (b) Home Sales versus Timeshare Sales Source: (a) U.S. Census Bureau (b) American Resort Development Association, NorthCourse (a subsidiary of Wyndham Worldwide), Ernst & Young Sept 11th 1st Gulf War Timeshare = Housing U.S. Timeshare Sales U.S. Home Sales $ Billion Millions of units |
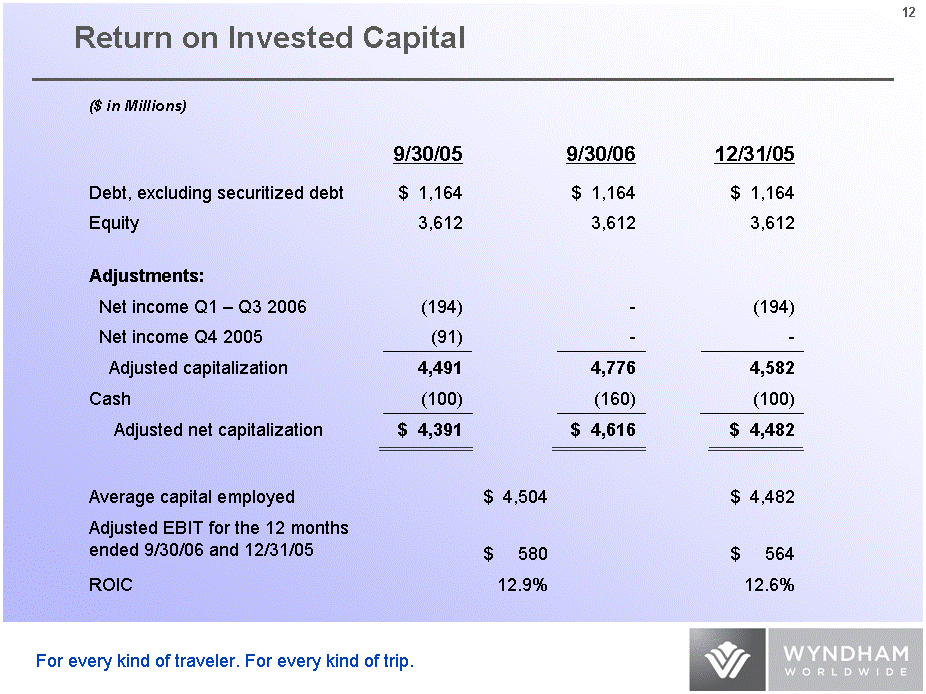
| Return on Invested Capital ($ in Millions) 9/30/05 9/30/06 12/31/05 Debt, excluding securitized debt $ 1,164 $ 1,164 $ 1,164 Equity 3,612 3,612 3,612 Adjustments: Net income Q1 - Q3 2006 (194) - (194) Net income Q4 2005 (91) - - Adjusted capitalization 4,491 4,776 4,582 Cash (100) (160) (100) Adjusted net capitalization $ 4,391 $ 4,616 $ 4,482 Average capital employed $ 4,504 $ 4,482 Adjusted EBIT for the 12 months ended 9/30/06 and 12/31/05 $ 580 $ 564 ROIC 12.9% 12.6% |

| Internal Rate of Return IRR is used to evaluate discrete opportunities: Key money for hotel management contracts 40% Most recent hotel brand acquisition 35% Incremental investment in vacation rental sites 25% Vacation ownership product development and growth capital expenditures 30% Additional benefits: Consumer finance spread Property management Upgrade sales to owner base Establish sales office |
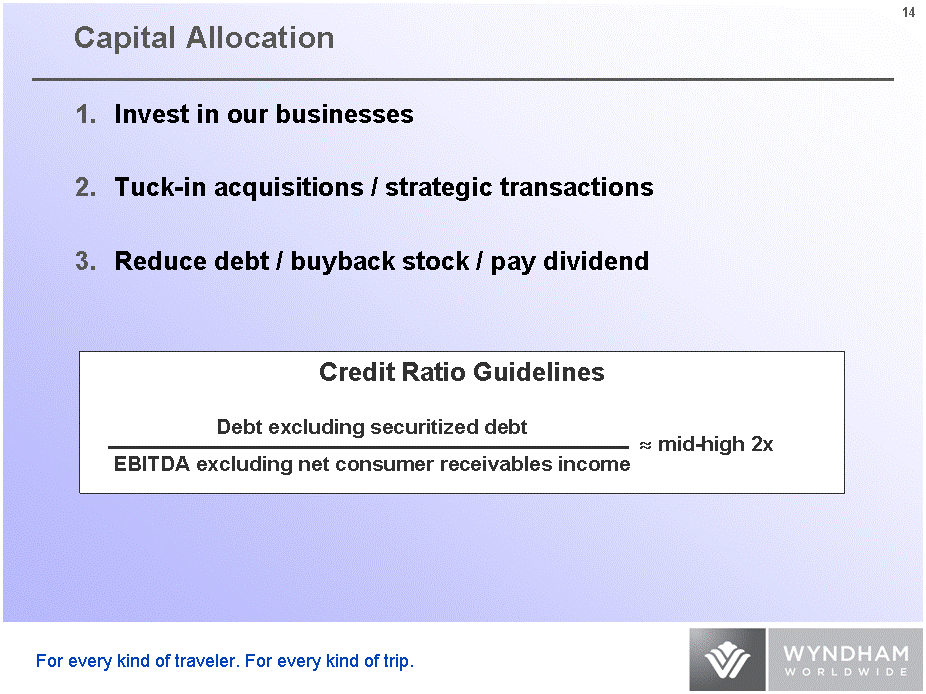
| Capital Allocation Invest in our businesses Tuck-in acquisitions / strategic transactions Reduce debt / buyback stock / pay dividend Credit Ratio Guidelines Debt excluding securitized debt EBITDA excluding net consumer receivables income ? mid-high 2x |
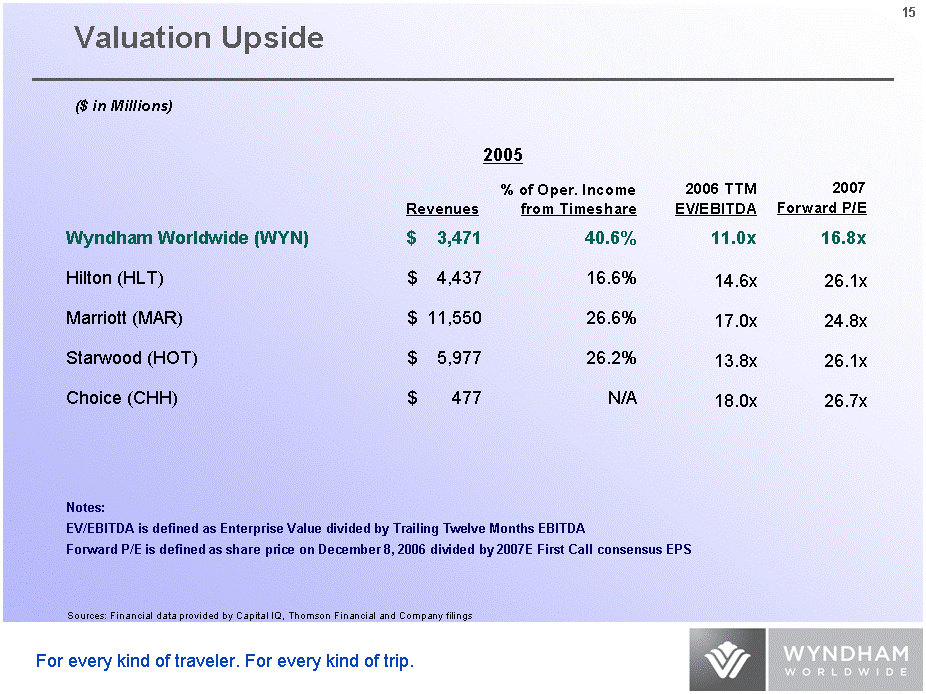
| Valuation Upside Notes: EV/EBITDA is defined as Enterprise Value divided by Trailing Twelve Months EBITDA Forward P/E is defined as share price on December 8, 2006 divided by 2007E First Call consensus EPS Sources: Financial data provided by Capital IQ, Thomson Financial and Company filings 2005 2005 Revenues % of Oper. Income from Timeshare Wyndham Worldwide (WYN) $ 3,471 40.6% Hilton (HLT) $ 4,437 16.6% Marriott (MAR) $ 11,550 26.6% Starwood (HOT) $ 5,977 26.2% Choice (CHH) $ 477 N/A 2006 TTM EV/EBITDA 2007 Forward P/E 11.0x 16.8x 14.6x 26.1x 17.0x 24.8x 13.8x 26.1x 18.0x 26.7x ($ in Millions) |
| Wyndham Worldwide Financial Overview Gina Wilson Chief Financial Officer |
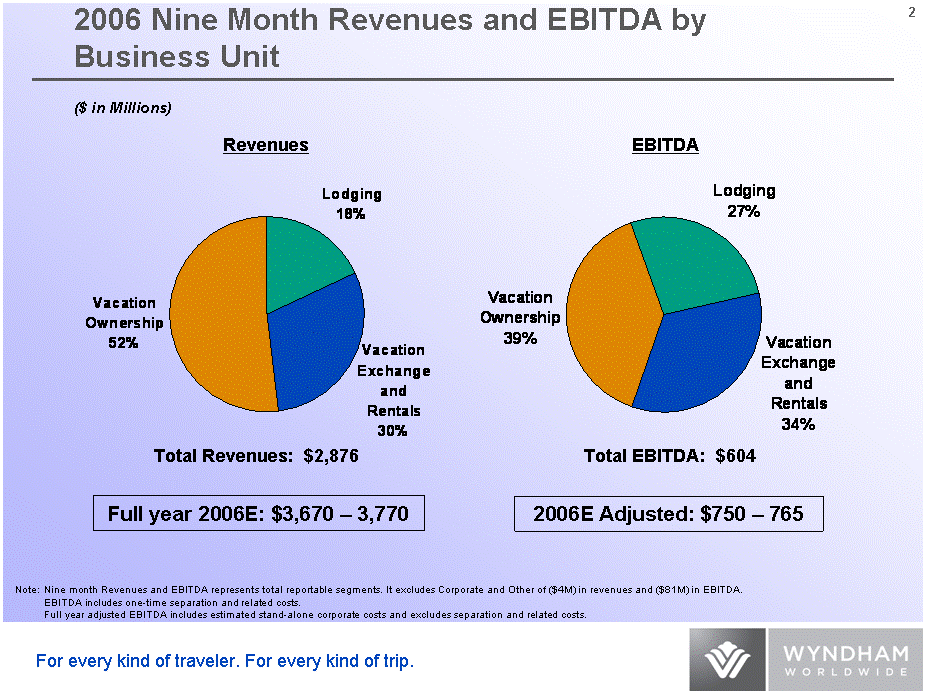
| 2006 Nine Month Revenues and EBITDA by Business Unit Lodging 0.27 0.27 Vacation Exchange and Rentals 0.34 0.34 Vacation Ownership 0.391 0.39 Lodging 0.18 Vacation Exchange and Rentals 0.3 Vacation Ownership 0.52 Revenues EBITDA Total Revenues: $2,876 Total EBITDA: $604 ($ in Millions) Note: Nine month Revenues and EBITDA represents total reportable segments. It excludes Corporate and Other of ($4M) in revenues and ($81M) in EBITDA. EBITDA includes one-time separation and related costs. Full year adjusted EBITDA includes estimated stand-alone corporate costs and excludes separation and related costs. Full year 2006E: $3,670 - 3,770 2006E Adjusted: $750 - 765 |
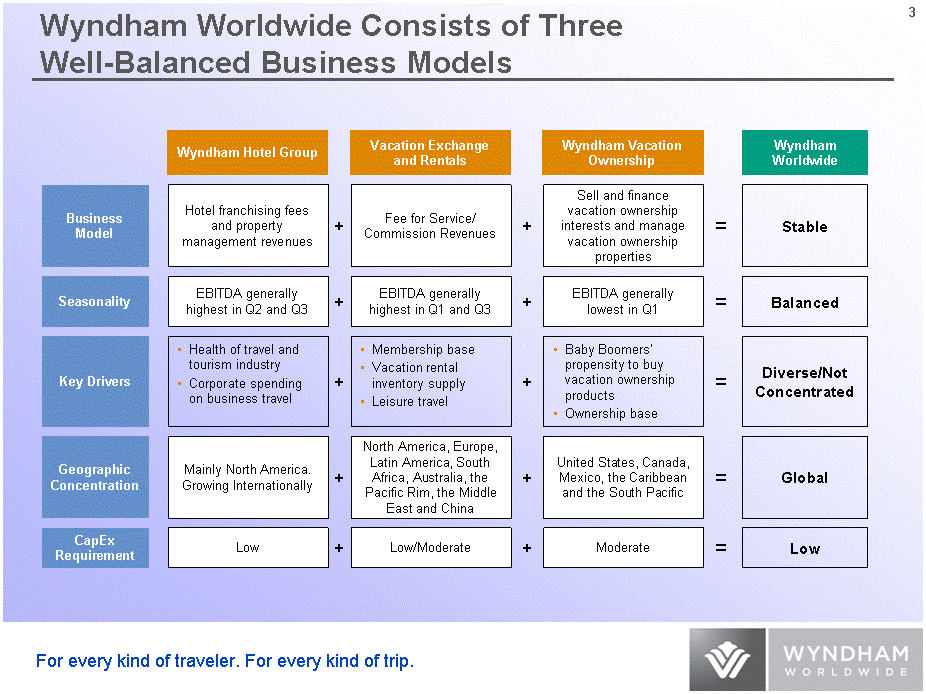
| Wyndham Worldwide Consists of Three Well-Balanced Business Models Wyndham Hotel Group Hotel franchising fees and property management revenues Business Model Health of travel and tourism industry Corporate spending on business travel Key Drivers Mainly North America. Growing Internationally Geographic Concentration Low CapEx Requirement Seasonality Wyndham Vacation Ownership Vacation Exchange and Rentals Stable Diverse/Not Concentrated Global Low Balanced = Wyndham Worldwide = = = = + + + + + + + + + + Fee for Service/ Commission Revenues Sell and finance vacation ownership interests and manage vacation ownership properties EBITDA generally highest in Q1 and Q3 Membership base Vacation rental inventory supply Leisure travel Baby Boomers' propensity to buy vacation ownership products Ownership base North America, Europe, Latin America, South Africa, Australia, the Pacific Rim, the Middle East and China United States, Canada, Mexico, the Caribbean and the South Pacific Moderate Low/Moderate EBITDA generally lowest in Q1 EBITDA generally highest in Q2 and Q3 |
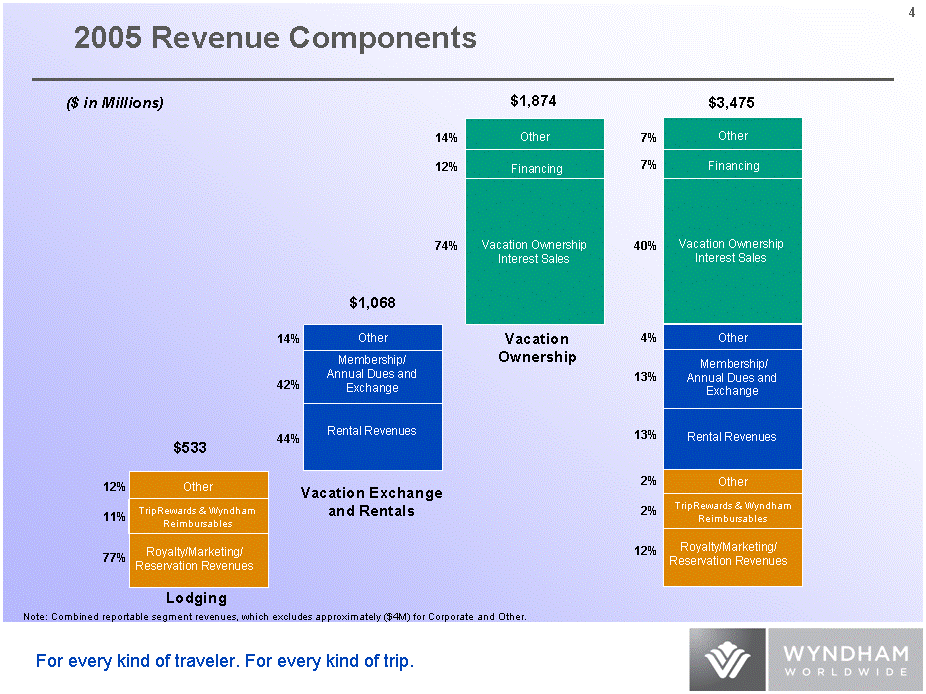
| 2005 Revenue Components Note: Combined reportable segment revenues, which excludes approximately ($4M) for Corporate and Other. Lodging $533 Vacation Exchange and Rentals $1,068 Vacation Ownership Other Financing Vacation Ownership Interest Sales $1,874 Membership/ Transaction Revenue Other Financing Vacation Ownership Interest Sales $3,475 Other Membership/ Annual Dues and Exchange Rental Revenues Membership/ Transaction Revenue Other Rental Revenues Membership/ Annual Dues and Exchange ($ in Millions) 12% 11% 77% 42% 14% 44% 14% 12% 74% 7% 7% 40% 4% 13% 13% 2% 2% 12% Royalty/Marketing/ Reservation Revenues TripRewards & Wyndham Reimbursables Other Royalty/Marketing/ Reservation Revenues TripRewards & Wyndham Reimbursables Other |
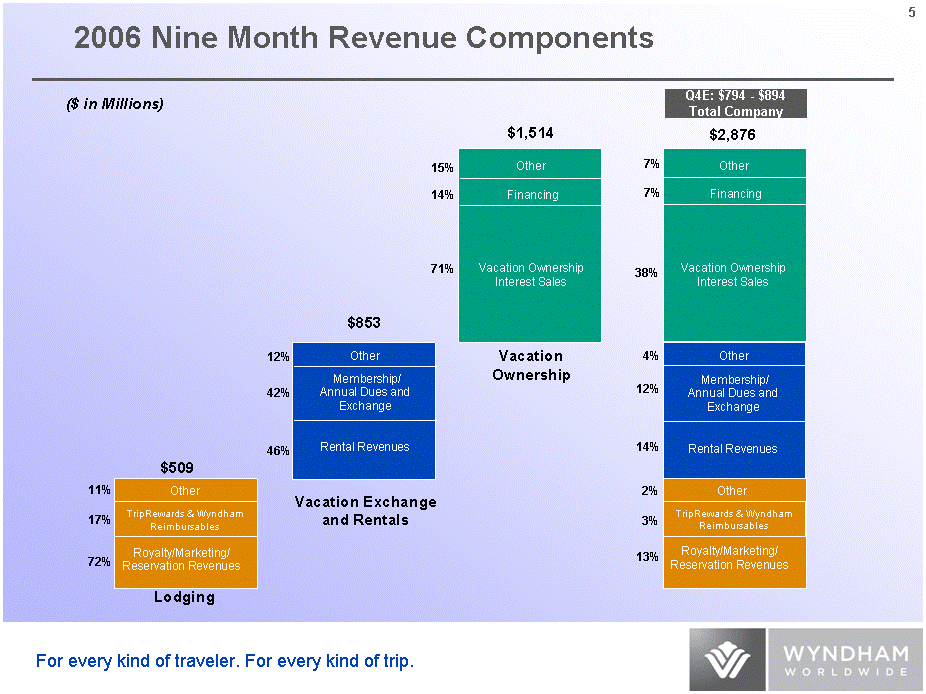
| 2006 Nine Month Revenue Components ($ in Millions) Lodging $509 Vacation Exchange and Rentals $853 Vacation Ownership Other Financing Vacation Ownership Interest Sales $1,514 Membership/ Transaction Revenue Other Financing Vacation Ownership Interest Sales $2,876 Other Membership/ Annual Dues and Exchange Rental Revenues Membership/ Transaction Revenue Other Rental Revenues Membership/ Annual Dues and Exchange 42% 12% 46% 15% 14% 71% 7% 7% 38% 4% 12% 14% Q4E: $794 - $894 Total Company Royalty/Marketing/ Reservation Revenues TripRewards & Wyndham Reimbursables Other 11% 17% 72% 2% 3% 13% Royalty/Marketing/ Reservation Revenues TripRewards & Wyndham Reimbursables Other |
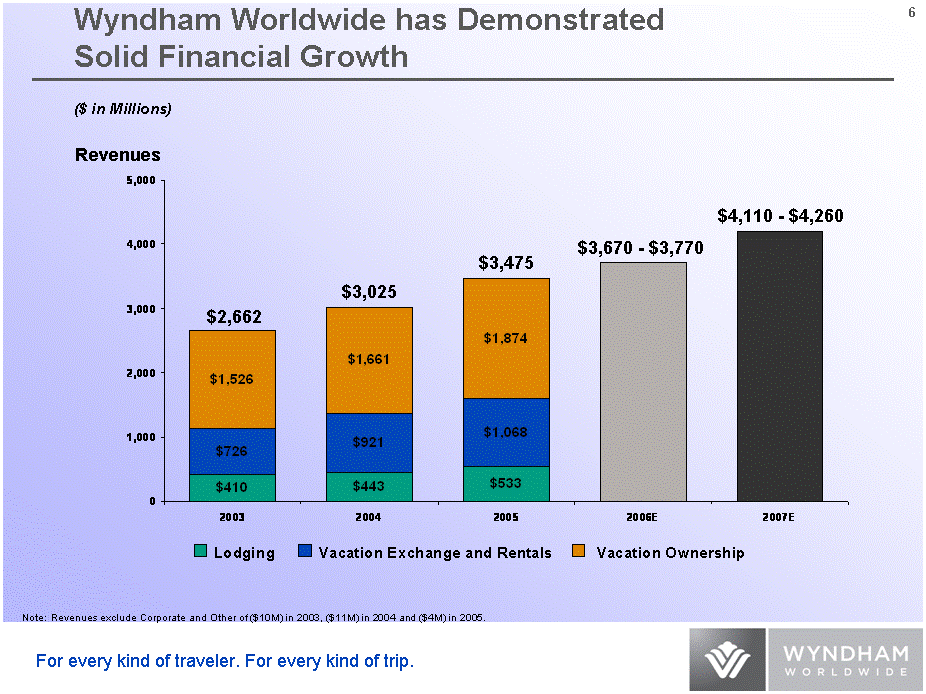
| Lodging RCI WVO 1998 1999 2000 485 485 2001 634 0 463 2003 410 726 1526 2004 443 921 1661 2005 533 1068 1874 2006E 3720 2007E 4190 Wyndham Worldwide has Demonstrated Solid Financial Growth Revenues $2,662 $3,025 $3,475 ($ in Millions) $3,670 - $3,770 $4,110 - $4,260 Note: Revenues exclude Corporate and Other of ($10M) in 2003, ($11M) in 2004 and ($4M) in 2005. Lodging Vacation Exchange and Rentals Vacation Ownership |
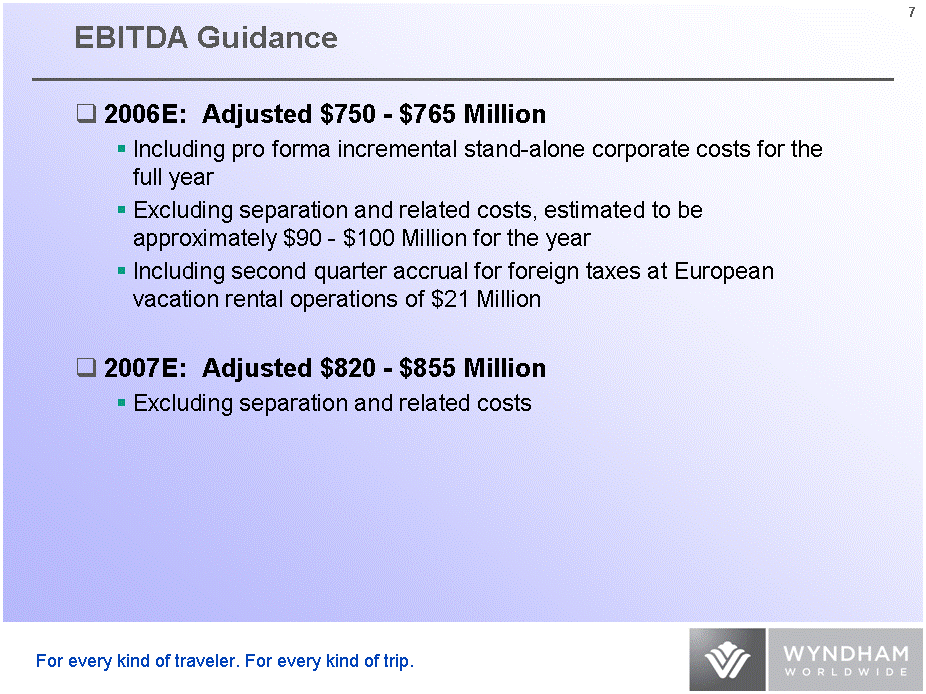
| EBITDA Guidance 2006E: Adjusted $750 - $765 Million Including pro forma incremental stand-alone corporate costs for the full year Excluding separation and related costs, estimated to be approximately $90 - $100 Million for the year Including second quarter accrual for foreign taxes at European vacation rental operations of $21 Million 2007E: Adjusted $820 - $855 Million Excluding separation and related costs |

| EBITDA Margin By Segment - As Reported Lodging Vacation Exchange & Rental Vacation Ownership 2004 0.43 0.31 0.16 2005 0.37 0.27 0.15 2006E 0.31 0.24 0.16 2007E Lodging Vacation Exchange and Rentals Vacation Ownership |
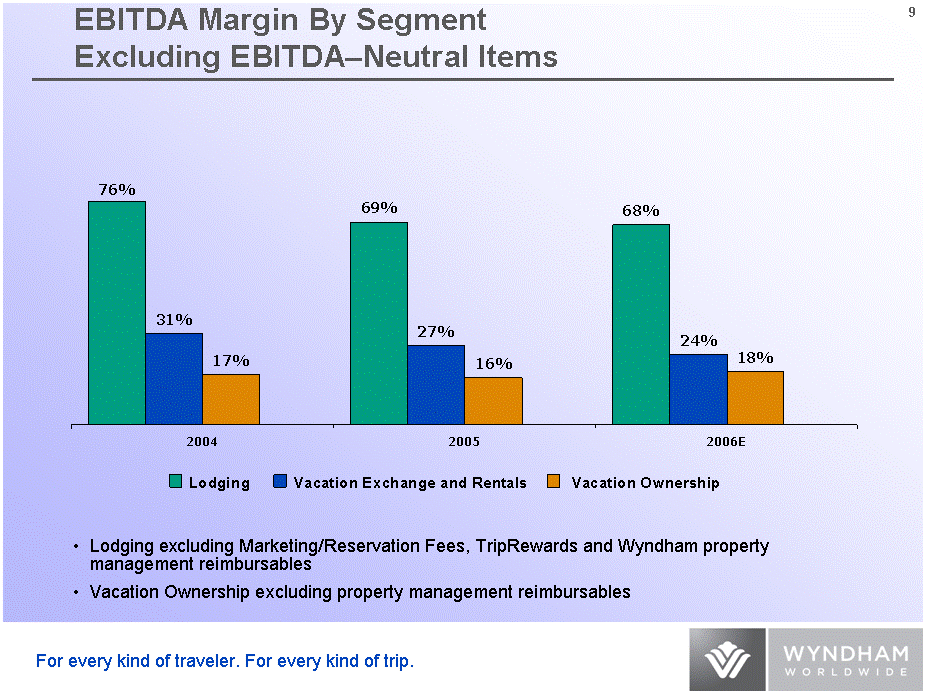
| EBITDA Margin By Segment Excluding EBITDA-Neutral Items Lodging excluding Marketing/Reservation Fees, TripRewards and Wyndham property management reimbursables Vacation Ownership excluding property management reimbursables Lodging Vacation Exchange & Rental Vacation Ownership 2004 0.76 0.31 0.17 2005 0.69 0.27 0.16 2006E 0.68 0.24 0.18 2007E Lodging Vacation Exchange and Rentals Vacation Ownership |
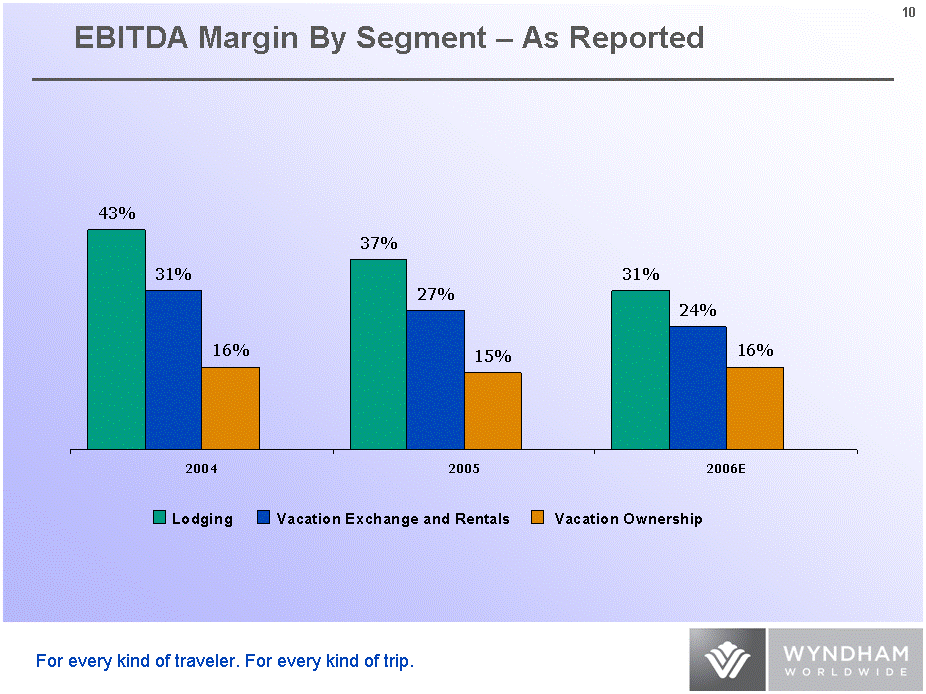
| EBITDA Margin By Segment - As Reported Lodging Vacation Exchange & Rental Vacation Ownership 2004 0.43 0.31 0.16 2005 0.37 0.27 0.15 2006E 0.31 0.24 0.16 2007E Lodging Vacation Exchange and Rentals Vacation Ownership |
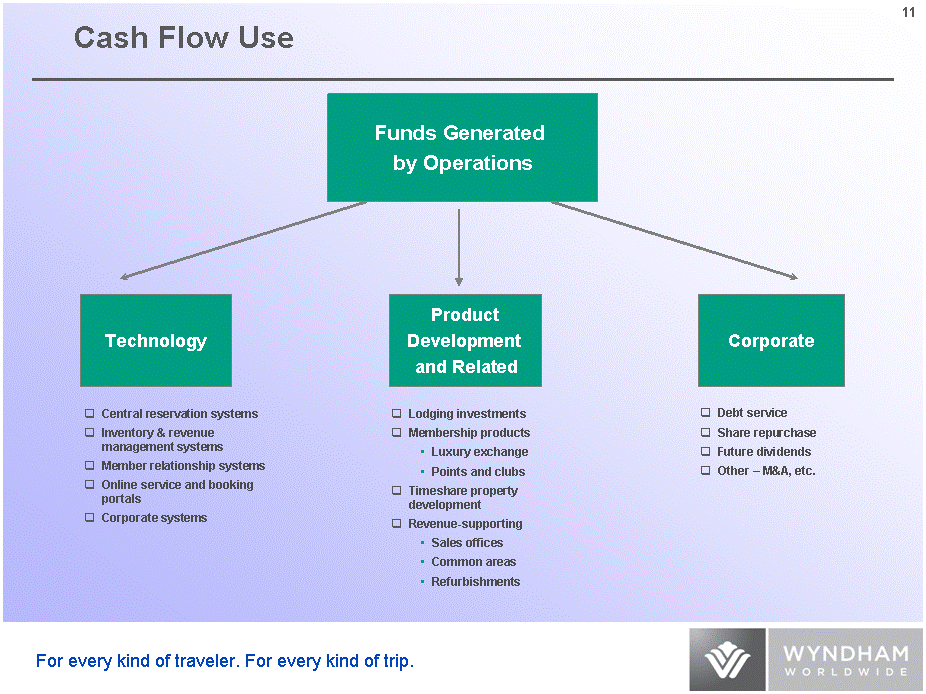
| Cash Flow Use Funds Generated by Operations Technology Product Development and Related Central reservation systems Inventory & revenue management systems Member relationship systems Online service and booking portals Corporate systems Lodging investments Membership products Luxury exchange Points and clubs Timeshare property development Revenue-supporting Sales offices Common areas Refurbishments Corporate Debt service Share repurchase Future dividends Other - M&A, etc. |

| Expected Adjusted Cash Flows ($ in Millions) Note: 2006 projections are before separation and related costs and contingent liabilities. Additionally, 2006 projections include estimated stand-alone corporate costs. Projections do not total because we do not expect the actual results of all line items be at the highest or lowest end of any projected range simultaneously. 2006E 2006E 2006E Low High Adjusted EBITDA $ 750 - $ 765 Net Interest Expense (70) - (65) Cash Taxes (100) - (110) Working Capital & Other (20) - - Subtotal 560 - 590 Timeshare Development & Financing (220) - (180) Capital Expenditures (200) - (180) Total $ 145 - $ 225 |
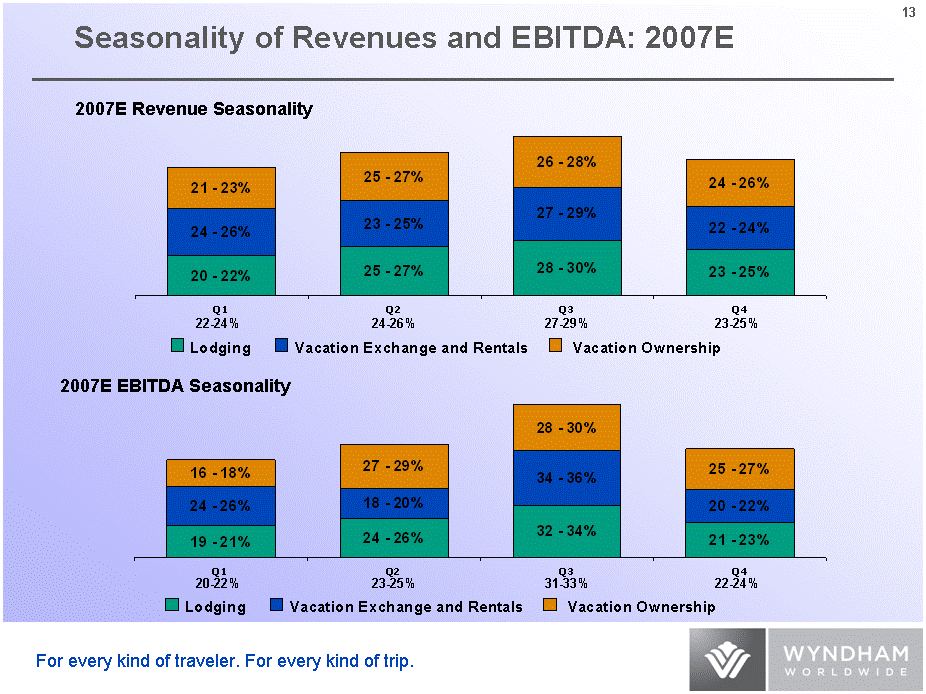
| Seasonality of Revenues and EBITDA: 2007E Lodging VNG Timeshare Q1 0.21 0.25 0.22 Q2 0.26 0.24 0.26 Q3 0.29 0.28 0.27 Q4 0.24 0.23 0.25 Lodging VNG Timeshare Q1 0.2 0.25 0.17 Q2 0.25 0.19 0.28 Q3 0.33 0.35 0.29 Q4 0.22 0.21 0.26 2007E Revenue Seasonality 2007E EBITDA Seasonality Lodging Vacation Exchange and Rentals Vacation Ownership Lodging Vacation Exchange and Rentals Vacation Ownership 22-24% 24-26% 27-29% 23-25% 20-22% 23-25% 31-33% 22-24% |
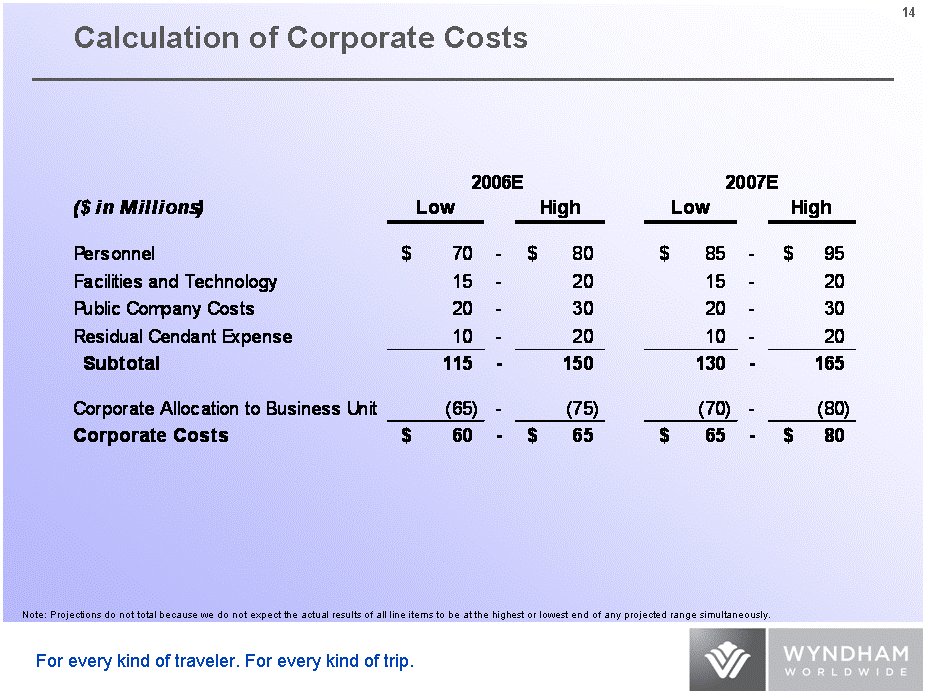
| Calculation of Corporate Costs Note: Projections do not total because we do not expect the actual results of all line items to be at the highest or lowest end of any projected range simultaneously. |
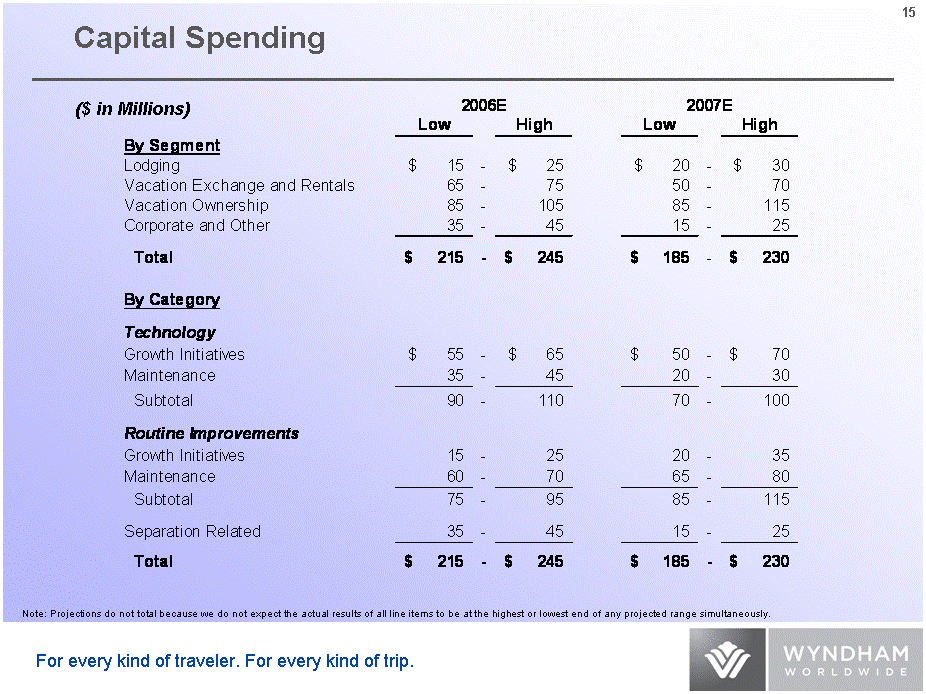
| Capital Spending Note: Projections do not total because we do not expect the actual results of all line items to be at the highest or lowest end of any projected range simultaneously. ($ in Millions) |
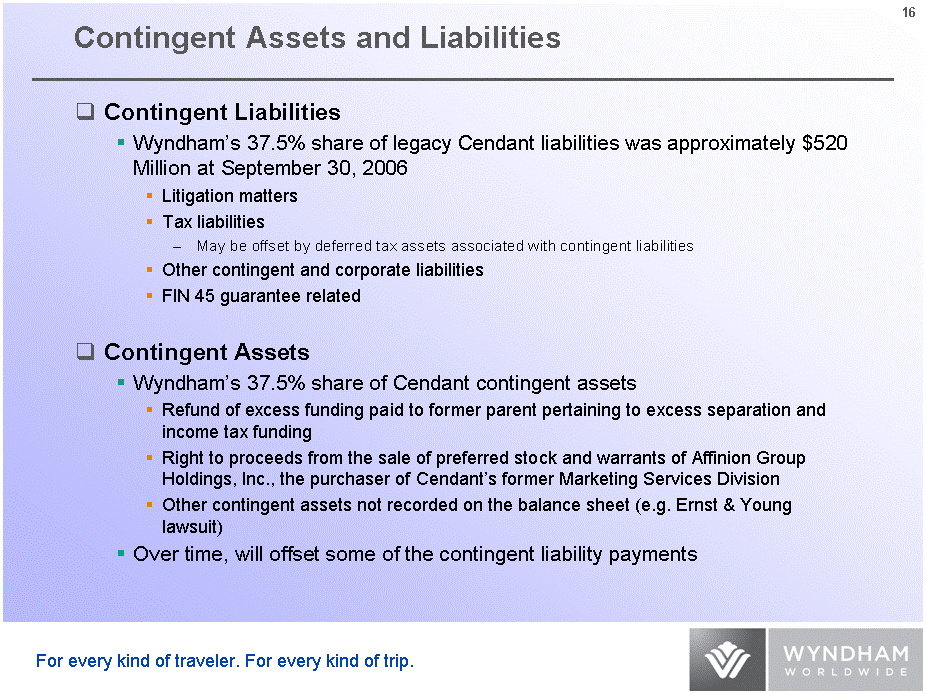
| Contingent Assets and Liabilities Contingent Liabilities Wyndham's 37.5% share of legacy Cendant liabilities was approximately $520 Million at September 30, 2006 Litigation matters Tax liabilities May be offset by deferred tax assets associated with contingent liabilities Other contingent and corporate liabilities FIN 45 guarantee related Contingent Assets Wyndham's 37.5% share of Cendant contingent assets Refund of excess funding paid to former parent pertaining to excess separation and income tax funding Right to proceeds from the sale of preferred stock and warrants of Affinion Group Holdings, Inc., the purchaser of Cendant's former Marketing Services Division Other contingent assets not recorded on the balance sheet (e.g. Ernst & Young lawsuit) Over time, will offset some of the contingent liability payments |
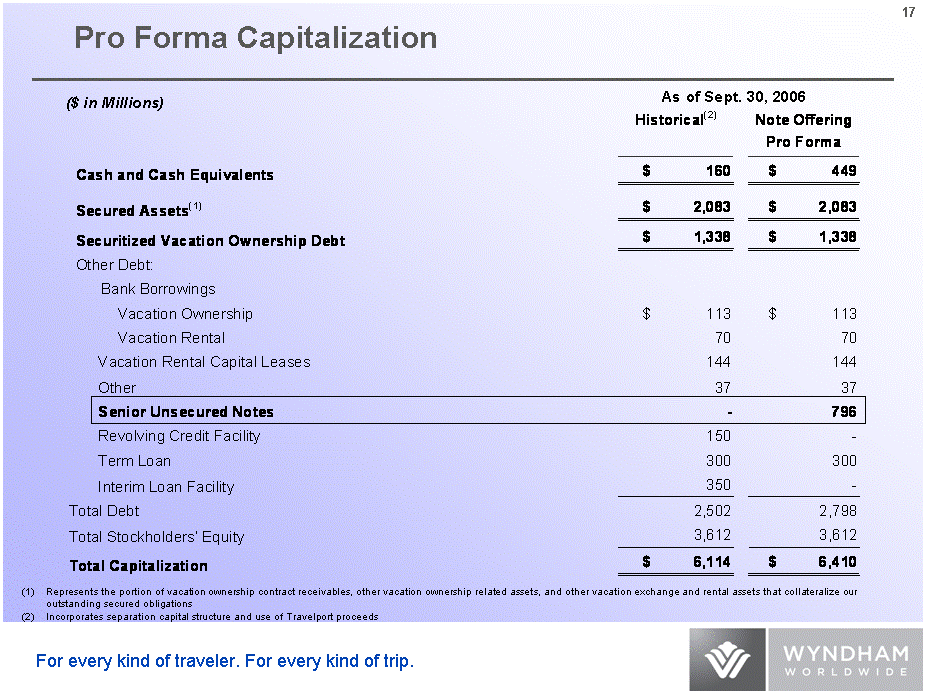
| ($ in Millions) (1) Represents the portion of vacation ownership contract receivables, other vacation ownership related assets, and other vacation exchange and rental assets that collateralize our outstanding secured obligations (2) Incorporates separation capital structure and use of Travelport proceeds Pro Forma Capitalization As of Sept. 30, 2006 |
| Remainder of 2006 and 2007 Outlook |

| Key Drivers Assumptions: 2006 and 2007 2006E vs. 2005 2006E vs. 2005 2007E vs. 2006E % Change % Change % Change Lodging RevPAR +12-14% +12-14% +5-7% Weighted Average Rooms Available +1-3% +1-3% +2-4% Vacation Exchange and Rentals Average Number of Members +3-5% +3-5% +4-6% Annual Dues and Exchange Revenue per Member Annual Dues and Exchange Revenue per Member Flat +0-2% Vacation Rental Transactions +3-5% +3-5% +4-6% Average Net Price per Vacation Rental +1-3% +1-3% +1-3% Vacation Ownership Tours +10-12% +10-12% +8-10% Volume Per Guest (VPG) +6-8% +6-8% +2-4% |
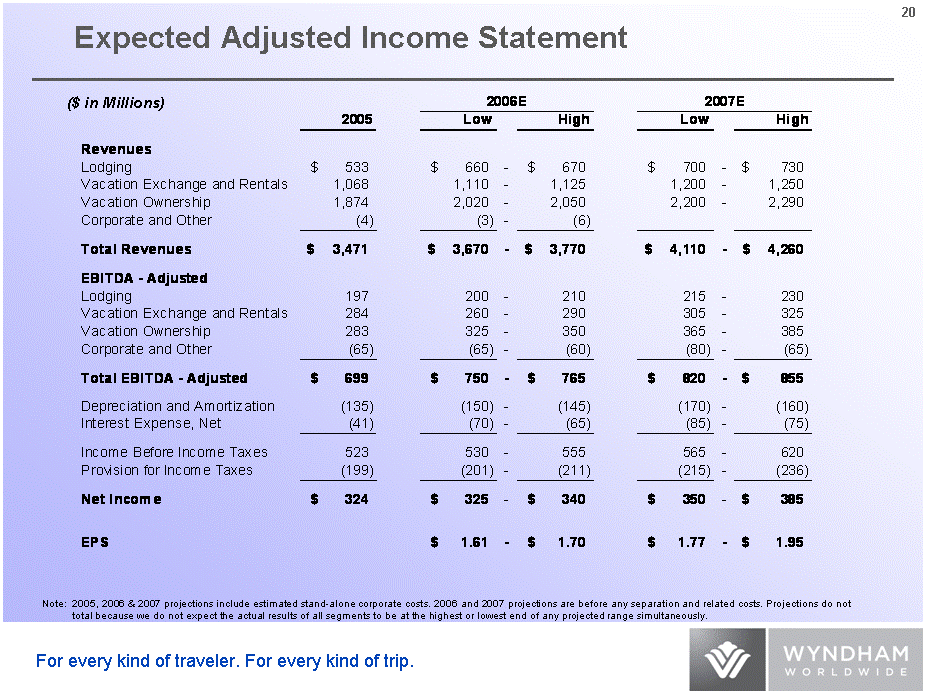
| Expected Adjusted Income Statement Note: 2005, 2006 & 2007 projections include estimated stand-alone corporate costs. 2006 and 2007 projections are before any separation and related costs. Projections do not total because we do not expect the actual results of all segments to be at the highest or lowest end of any projected range simultaneously. ($ in Millions) |
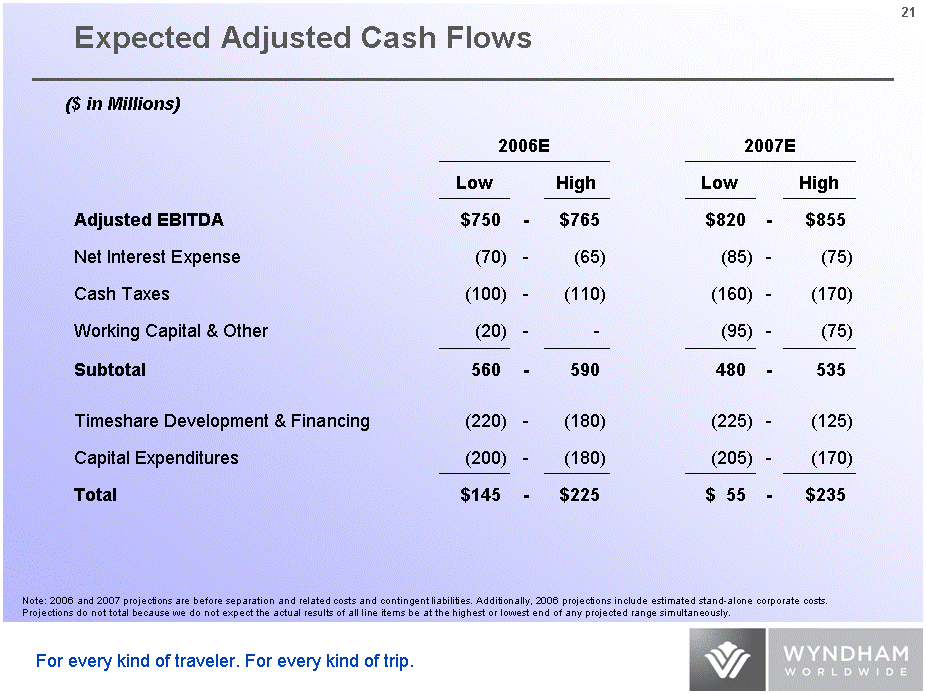
| Expected Adjusted Cash Flows ($ in Millions) Note: 2006 and 2007 projections are before separation and related costs and contingent liabilities. Additionally, 2006 projections include estimated stand-alone corporate costs. Projections do not total because we do not expect the actual results of all line items be at the highest or lowest end of any projected range simultaneously. 2006E 2006E 2006E 2007E 2007E 2007E Low High Low High Adjusted EBITDA $750 - $765 $820 - $855 Net Interest Expense (70) - (65) (85) - (75) Cash Taxes (100) - (110) (160) - (170) Working Capital & Other (20) - - (95) - (75) Subtotal 560 - 590 480 - 535 Timeshare Development & Financing (220) - (180) (225) - (125) Capital Expenditures (200) - (180) (205) - (170) Total $145 - $225 $ 55 - $235 |
| Sensitivity Analysis |
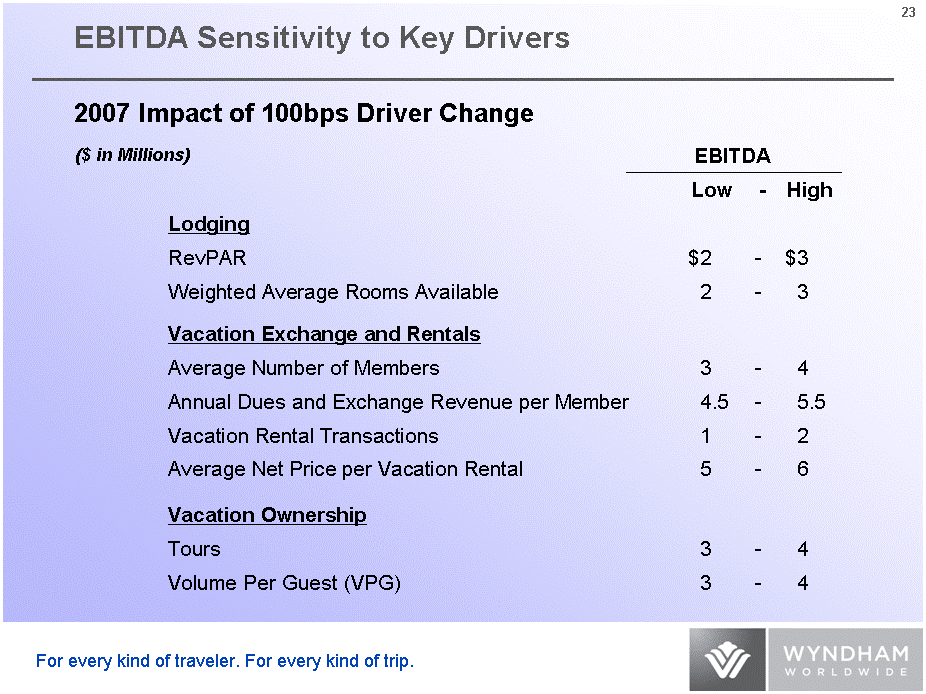
| EBITDA Sensitivity to Key Drivers 2007 Impact of 100bps Driver Change ($ in Millions) EBITDA EBITDA EBITDA EBITDA Low Low - High Lodging Lodging RevPAR RevPAR $2 - $3 Weighted Average Rooms Available Weighted Average Rooms Available 2 - 3 Vacation Exchange and Rentals Vacation Exchange and Rentals Average Number of Members Average Number of Members 3 - 4 Annual Dues and Exchange Revenue per Member Annual Dues and Exchange Revenue per Member 4.5 - 5.5 Vacation Rental Transactions Vacation Rental Transactions 1 - 2 Average Net Price per Vacation Rental Average Net Price per Vacation Rental 5 - 6 Vacation Ownership Vacation Ownership Tours Tours 3 - 4 Volume Per Guest (VPG) Volume Per Guest (VPG) 3 - 4 |

| Wyndham Worldwide Corporation Stephen P. Holmes Chairman & CEO |
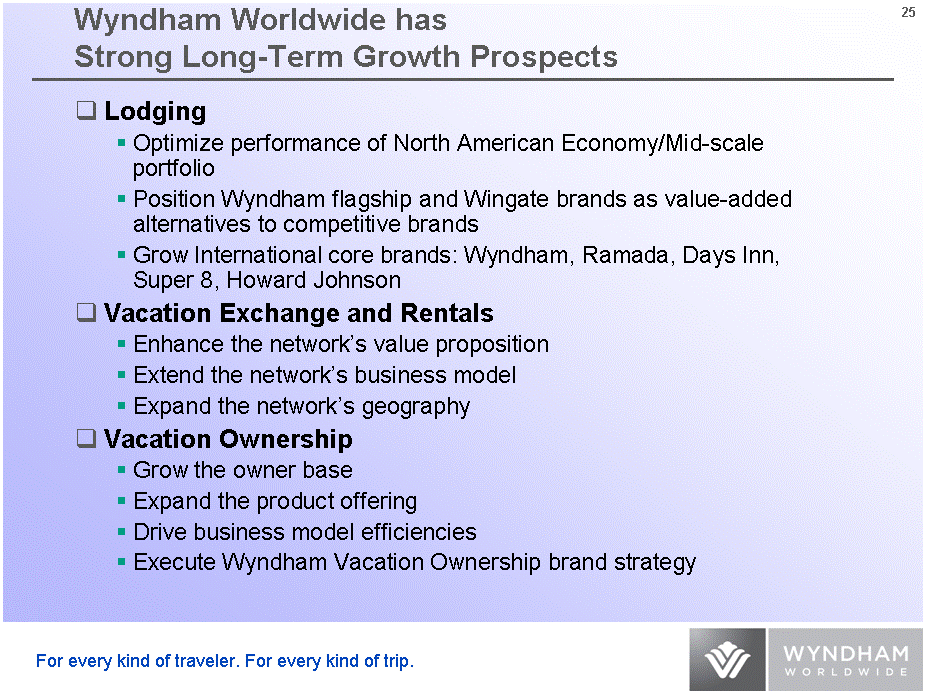
| Wyndham Worldwide has Strong Long-Term Growth Prospects Lodging Optimize performance of North American Economy/Mid-scale portfolio Position Wyndham flagship and Wingate brands as value-added alternatives to competitive brands Grow International core brands: Wyndham, Ramada, Days Inn, Super 8, Howard Johnson Vacation Exchange and Rentals Enhance the network's value proposition Extend the network's business model Expand the network's geography Vacation Ownership Grow the owner base Expand the product offering Drive business model efficiencies Execute Wyndham Vacation Ownership brand strategy |

| Glossary - Wyndham Worldwide Investor Day |
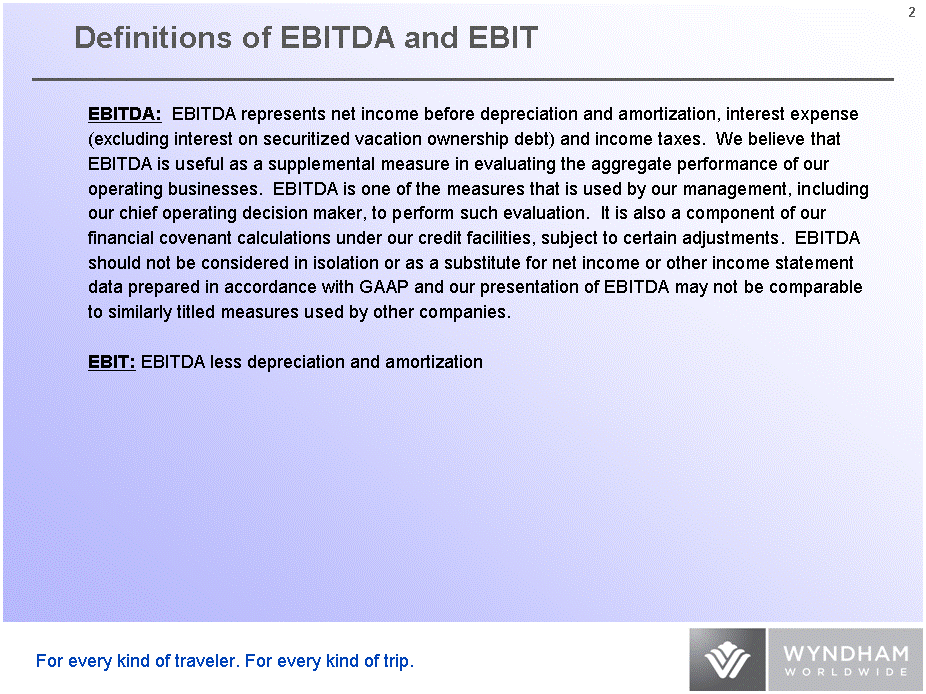
| Definitions of EBITDA and EBIT EBITDA: EBITDA represents net income before depreciation and amortization, interest expense (excluding interest on securitized vacation ownership debt) and income taxes. We believe that EBITDA is useful as a supplemental measure in evaluating the aggregate performance of our operating businesses. EBITDA is one of the measures that is used by our management, including our chief operating decision maker, to perform such evaluation. It is also a component of our financial covenant calculations under our credit facilities, subject to certain adjustments. EBITDA should not be considered in isolation or as a substitute for net income or other income statement data prepared in accordance with GAAP and our presentation of EBITDA may not be comparable to similarly titled measures used by other companies. EBIT: EBITDA less depreciation and amortization |

| Reconciliation of EBITDA by Segment Excluding EBITDA-Neutral Items |
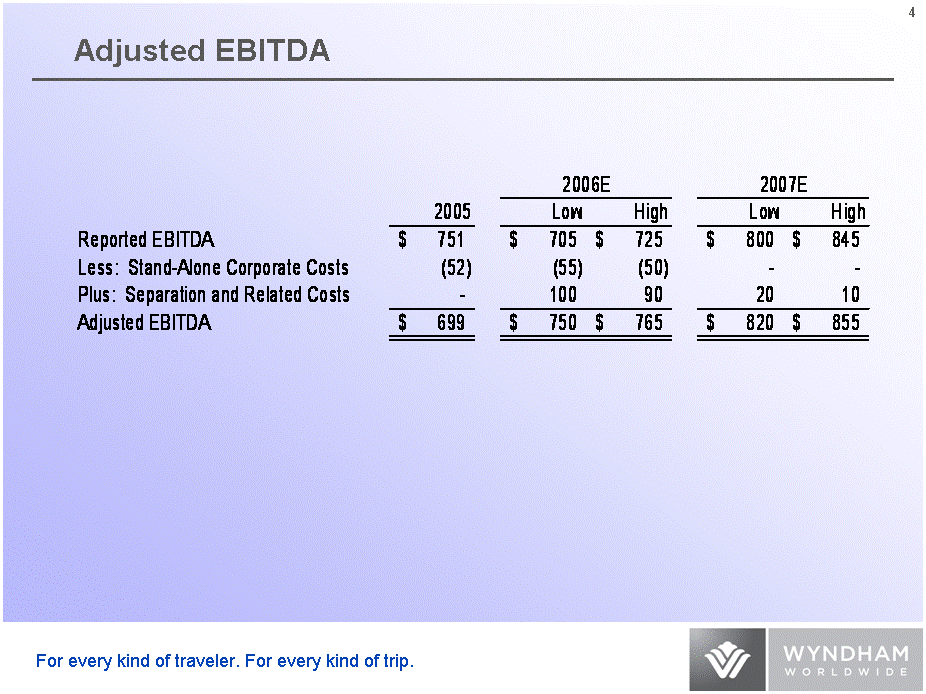
| Adjusted EBITDA |
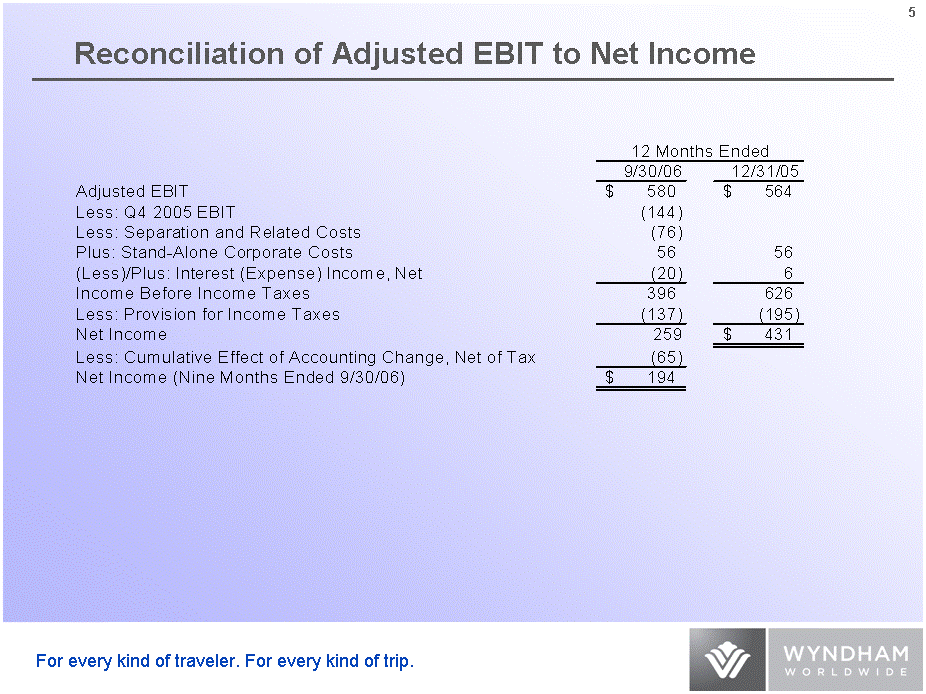
| Reconciliation of Adjusted EBIT to Net Income |